
Lesson 10 – How to Use Data to Find Trends and Examine Relationships
Introduction
In the era of big data, harnessing the power of statistical analysis is crucial for extracting meaningful insights, identifying trends, and examining relationships within datasets. Whether you’re a researcher, business analyst, or enthusiast, understanding how to navigate statistical tools can unlock a wealth of information. This guide explores the key steps to effectively use data for trend identification and relationship examination through statistical analysis.
I. Defination of Statistical Analysis
The act of gathering and analyzing data in order to identify patterns and trends is known as statistical analysis. It is a way of reducing bias from data evaluation through the use of numerical analysis. This method is effective for gathering research interpretations, constructing statistical models, and arranging surveys and studies.
Statistical analysis is a scientific tool in AI and ML that assists in the collection and analysis of vast volumes of data in order to detect common patterns and trends and transform them into useful information. In layman’s terms, statistical analysis is a data analysis technique that aids in the extraction of useful conclusions from raw and unstructured data.
The results are reached using statistical analysis, which aids decision-making and assists firms in formulating future projections based on historical trends. It is described as the science of gathering and analyzing data in order to find and portray trends and patterns. Statistical analysis includes working with numbers and is used by corporations and other institutions to extract relevant information from data.
II. Types of Statistical Analysis
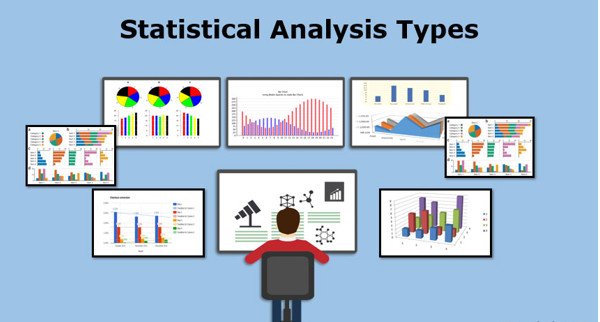
Given below are the 6 types of statistical analysis:
1. Descriptive Analysis
Descriptive statistical analysis is gathering, interpreting, analyzing, and summarizing data in order to show it in charts, graphs, and tables. It merely makes difficult data easier to read and comprehend rather than forming judgments.
2. Inferential Analysis
The goal of inferential statistical analysis is to extract meaningful inferences from the data that has been evaluated. It investigates the link between several factors or provides projections for the entire population.
3. Predictive Analysis
Predictive statistical analysis is a sort of statistical analysis that uses data to determine historical patterns and forecast future events. It conducts statistical data analysis using machine learning methods, data mining, data modeling, and artificial intelligence.
4. Prescriptive Analysis
Prescriptive analysis analyzes data and recommends the best course of action depending on the findings. It is a sort of statistical analysis that assists you in making an educated decision.
5. Exploratory Data Analysis
Exploratory analysis is similar to inferential analysis, except it involves investigating previously undiscovered data relationships. It examines the data for potential links.
6. Causal Analysis
The causal statistical analysis is concerned with establishing the cause and effect relationship between various variables in raw data. In other words, it determines why something occurs and how it affects other factors. Businesses can use this process to determine the cause of failure.
III. Importance of Statistical Analysis
Statistical analysis removes extraneous information and classifies key data in a straightforward manner, making the huge task of arranging inputs look so simple. Following the collection of data, statistical analysis may be used for a variety of objectives. Some of them are as follows:
- The statistical analysis helps to summarize massive volumes of data into easily consumable bits.
- Statistical analysis contributes to the efficient planning of laboratory, field, and survey research.
- In every field of study, statistical analysis may aid in solid and effective planning.
- Statistical analysis helps to develop broad generalizations and anticipate how much of something will occur under specific situations.
- Statistical techniques, which are powerful instruments for analyzing numerical data, are used in almost every field of research. Statistical techniques have been developed and are being used more often in physical and biological disciplines such as genetics.
- A businessman, a manufacturer, and a researcher all employ statistical methodologies in their work. Banks, insurance companies, and government institutions all have statistics divisions.
- A contemporary administrator, whether public or private, relies on statistical data to make sound choices.
- Politicians can use statistics to back up and corroborate their assertions, as well as to clarify the topics they address.
IV. Statistical Analysis Process
The following are the five steps to doing a statistical analysis that you should take:
- Step 1: Determine and define the nature of the data to be analyzed.
- Step 2: The next step is to build a link between the studied data and the sample population to which it belongs.
- Stage 3: The third stage is to develop a model that properly explains and summarizes the population-data connection.
- Step 4: Determine whether or not the model is correct.
- Step 5: Use predictive analysis to forecast future patterns and events that are likely to occur.
V. Statistical Analysis Methods
Although there are several ways for performing data analysis, the following are the five most commonly used and popular statistical analysis approaches:
1. Mean
One of the most prominent statistical analysis approaches is mean or average mean. The mean defines the general trend of the data and is quite easy to compute. The mean is computed by adding all of the values in the data set and then dividing by the number of data points. Despite the ease of computation and benefits, using mean as the primary statistical indicator is not recommended since it might lead to incorrect decision making.
2. Typical Deviation
Another extensively used statistical tool or procedure is standard deviation. It examines how distinct data points deviate from the mean of the total data collection. It specifies how the data in the data set is distributed around the mean. It can be used to determine whether or not the study findings can be generalized.
3. Regression
Regression is a statistical method for determining the cause and effect connection between variables. It establishes the connection between a dependent and an independent variable. It is commonly used to forecast future trends and occurrences.
4. Hypothesis Validation
The validity or truthfulness of a conclusion or argument may be tested against a data set via hypothesis testing. The hypothesis is an assumption formed at the start of the investigation that might be true or untrue based on the outcomes of the analysis.
5. Choosing A Sample Size
Sample size determination, often known as data sampling, is a strategy for obtaining a representative sample from the complete population. When the population is exceedingly huge, this strategy is utilized. You may select from a variety of data collection approaches, including snowball sampling, convenience sampling, and random sampling.
VI. Software for Statistical Analysis
Because no one can execute highly sophisticated statistical computations with accuracy, statistical analysis is a time-consuming and expensive procedure. Statistical software has evolved into a critical tool for businesses performing data analysis. The program employs Artificial Intelligence and Machine Learning to do complicated computations, discover trends and patterns, and generate accurate charts, graphs, and tables in seconds.
VII. Examples of Statistical Analysis
To learn more about statistical analysis, look at the standard deviation sample calculation provided below.
The weights in centimeters of 5 pizza bases are as follows:
| Particulars (Weight in cms) | Mean Deviation | Square of Mean Deviation |
|---|---|---|
|
9 |
9-6.4 = 2.6 |
(2.6)2 = 6.76 |
|
2 |
2-6.4 = – 4.4 |
(-4.4)2 = 19.36 |
|
5 |
5-6.4 = – 1.4 |
(-1.4)2 = 1.96 |
|
4 |
4-6.4 = – 2.4 |
(-2.4)2 = 5.76 |
|
12 |
12-6.4 = 5.6 |
(5.6)2 = 31.36 |
- Calculation of Mean = (9+2+5+4+12)/5 = 32/5 = 6.4
- Calculation of mean of squared mean deviation = (6.76+19.36+1.96+5.76+31.36)/5 = 13.04
- Sample Variance = 13.04
- Standard deviation = √13.04 = 3.611
Conclusion
In conclusion, utilizing statistical analysis to find trends and examine relationships in data is a powerful skill. By following these steps, you can uncover valuable insights that inform decision-making, support research endeavors, and drive innovation in various fields. Whether you are navigating business data or conducting academic research, statistical analysis is a key tool for unlocking the secrets hidden within your datasets.