
Lesson 7 – Inverse and Quadratic Relationships
Introduction
Inverse and quadratic relationships hold significant importance in mathematics and various academic disciplines. Comprehending these relationships enables us to examine and simulate real-world phenomena, resolve problems, and make predictions. This article will delve into inverse and quadratic relationships, utilizing graphical representations and practical examples to facilitate understanding and application.
I. Inverse Relationship
1. Definition
The inverse of a relation is formed by exchanging or swapping the elements or coordinates of each ordered pair within the relation. Inverse relations in sets can be identified by utilizing ordered pairs. The domain and range of an inverse relationship can be written by interchanging the domain and range of the original relation. The domain of relation becomes the range of its inverse, while the range of concern becomes the domain of its inverse.
Inverse Relationship
Mathematical Definition of Inverse Relation:
Let’s consider a relation R in the form {(x, y): x ∈ A and y ∈ B. The inverse association of R is written by R-1, and it can be defined as R-1 = {(y, x): y ∈ B and x ∈ A}. If R represents from set A to set B, then R-1 represents from set B to set A. In simpler terms, if (x, y) ∈ R, then (y, x) ∈ R-1, and vice versa. Additionally, it is essential to note that a relation in sets meaning R is a subset of A x B, and the inverse relation R-1 represents a subset of B x A.
2. Inverse Relationship Graph
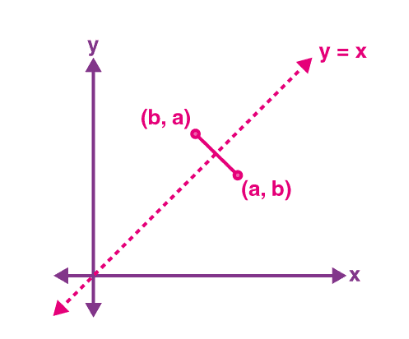
Suppose we have an equation that represents a relation between variables x and y. In that case, we can find the equation for the inverse relation by interchanging the roles of x and y. This means replacing every occurrence of x in the equation with y and every circumstance of y with x. The graphs are symmetrical, forming mirror images of each other across the line y = x.
For instance, let’s consider an ordered pair (a, b) that belongs to a relation described by an x and y equation. The inverse relation of this equation will contain the ordered pair (b, a), reflecting the original team across the line y = x. This concept is illustrated in the accompanying figure. To further understand the concept of inverse relations, let’s explore an example.
Inverse Relationship Graph
3. Example
Example 1:
Determine the inverse of a relation R represented by the set {(-15, -4), (-18, -8), (-6, 1), (-12.55, 3)} and provide the domain and range of the inverse relation.
Solution:
Given, R = {(-15, -4), (-18, -8), (-6, 1), (-12.55, 3)}
Domain of R = {-15, -18, -6, -12.55}
Range of R = {-4, -8, 1, 3}
Inverse of R (denoted as R-1) = {(-4, -15), (-8, -18), (1, -6), (3, -12.55)}
Domain of R-1 = {-4, -8, 1, 3}
Range of R-1 = {-15, -18, -6, -12.55}
Example 2:
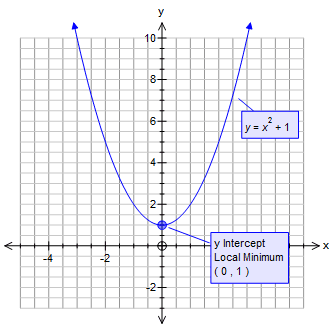
Determine the inverse function of f(x) = x^2+1 if it exists. Provide its domain and range.
This function doesn’t have any domain restrictions. Based on the observation, when graphed, it is evident that there are multiple points of intersection for certain horizontal lines. Consequently, this indicates that its inverse cannot be considered a function. Therefore, proceeding with the earlier steps is unnecessary to find the inverse. I will stop here.
Graph f(x) = x2+1
II. Quadratic Relationship
1. Definition
A quadratic relationship refers to a mathematical concept describing the connection between two variables, where the squared value of one variable equals the other variable. If you square one variable in a linear equation, you will obtain a quadratic equation.
When we plotted on a coordinate plane, the points of a quadratic relationship form a parabola. Quadratic equations are also known as second-degree equations. A typical example of a quadratic relationship is the connection between speed and distance traveled, expressed by the equation d = \text{s}^1
Proportional Relationship: Linear Quadratic, Inverse, Inverse Square
2. Formula
The formula of a quadratic relationship typically consists of a variable raised to the power of 2 (e.g., \text{x}^2). It can be represented in one of three formats:
- y = ax^2 + bx + c: In this format, the parameter c represents the point of intersection with the vertical axis.
- y = a(x – p)^2 + q: In this format, the parameters p and q correspond to the coordinates of the vertex (p, q) on the parabola.
- y = a(x – m)(x – n): In this format, the parameters m and n are the x-coordinates of the points where the parabola intersects the horizontal axis.
Examples
- y = 3x^2 The point of intersection with the vertical axis is (0, 0).
- y = –x^2 + 5x – 8 The point of intersection with the vertical axis is (0, –8).
- y = –4(x – 2)^2 + 6 The vertex coordinates are (2, 6).
- y = 3(x + 1)2 – 8 The coordinates of the vertex are (–1, –8).
- y = –2(x + 7)(x – 5) The points of intersection with the horizontal axis are (–7, 0) and (5, 0).
3. Graphs
Here are two examples of graphs representing quadratic relationships. The shape of these graphs is known as a parabola. When plotting the graph of a quadratic relation, it is essential to include significant points such as the vertex and any intersections with the axes. However, there may be no intersections with the x-axis.
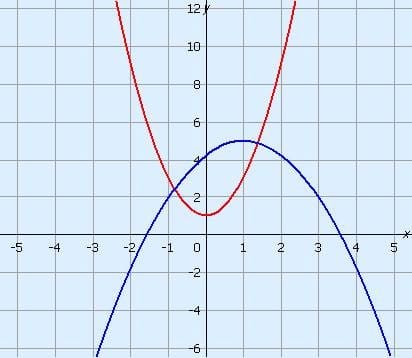
Graph representing the quadratic relationship
- The highest or lowest point on the graph is referred to as the vertex.
- The vertex of the red parabola, which opens upward, is located at the point (0, 1).
- The vertex of the blue parabola, which opens downward, is at the point (1, 5).
- The closer the value of "a" (the coefficient of x2) is to 0, the wider the parabola becomes.
- The red graph represents an upward-opening parabola with a positive value for "a."
- The blue graph represents a downward-opening parabola with a negative value for "a."
As mentioned earlier, including significant points like the vertex and intersections with the axes in your graph is crucial. While these points are often around the origin, larger values of “b” and “c” may require additional calculation and searching.
Before plotting the graph, you may want to calculate these significant points. To find the vertex, use the formula xvertex = –b/2a with y = ax2 + bx + c. To determine the intersections with the x-axis, you solve the equation when y = 0.
III. Practice Problems
Inverse Relationships:
Inverse Proportion:
If x is inversely proportional to y and x = 10 when y = 5, find the value of x when y = 8.
Inverse Square Law:
The intensity of light is inversely proportional to the square of the distance from the source. If the intensity is 16 units at a distance of 22 meters, find the intensity at 44 meters.
Quadratic Relationships:
Quadratic Equation Roots:
Solve the quadratic equation 2x^2 − 5x + 3 = 0 for x.
Vertex of a Quadratic Function:
For the quadratic function f(x) = 3x^2 − 6x + 2, find the vertex of the parabola.
Quadratic Word Problem:
The area of a rectangular garden is given by A = x^2 − 4x + 3, where x is the length of one side. Find the value of x that maximizes the area.
Quadratic Regression:
Given the data points (1,3), (2,8), and (3,15), find the quadratic equation that best fits the data.
Quadratic Inequalities:
Solve the inequality x^2 − 4x < 5.
Projectile Motion:
The height ℎ of a projectile launched upward is given by h(t) = −5t^2 + 20t + 10, where t is the time in seconds. Find the maximum height and the time it takes to reach it.
These problems cover a range of concepts related to inverse relationships and quadratic functions.
Conclusion
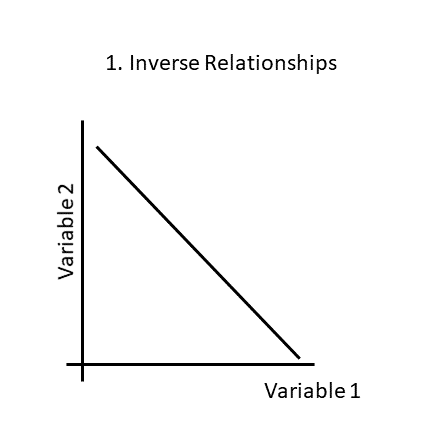
To summarize, an inverse relationship indicates that when one variable increases, the other decreases. However, it’s essential to note that the relationship between two variables can change over time. On the other hand, a quadratic relationship refers to a nonlinear connection between two variables, often represented by a U-shaped curve known as a parabola. Understanding inverse and quadratic relationships is crucial for comprehending the underlying relations between variables and making informed predictions and decisions across various fields of study.