
Lesson 6 – Direct and Linear Relationships
Introduction
A relationship serves as a means of explaining the influence of one variable on another. Mathematicians, physicists, and engineers employ various terms to describe mathematical relationships. Given that numerous physical relationships in fields such as electrostatics, electrodynamics, and thermodynamics are expressed through mathematical equations, comprehending the connections between variables becomes essential in understanding numerous technologies. This article explores the definition of a direct, linear relationship, identifies its equation, and provides several examples.
I. Direct Relationship
1. Definition:
A direct relationship refers to a connection between variables where they consistently increase or decrease together. It signifies a cause-and-effect relationship between the two variables. When variable x increases, variable y also increases, and when x decreases, y decreases as well. Sometimes referred to as a positive relationship, a direct relationship on a graph consistently exhibits a positive slope.

Direct Relationship
This type of relationship commonly arises in mathematical and scientific models. Although a direct relationship may appear straightforward initially, it can possess underlying complexity. For example, a direct relationship may not always manifest as a perfectly straight line when representing data points on a graph. Some variability in the data might cause slight curvature in the line. However, if a line were to be drawn through all the data points, it would generally follow a linear pattern, indicating a direct relationship.
2. Equation:
Direct relationships are represented by the equation y = kx, where k represents the constant of proportionality. If x is not zero, the constant of proportionality can be calculated as k = y/x. This implies that the ratio between the two variables is always a constant value. Alternatively, the direct variation equation can be expressed as x = y / k, indicating that x is directly proportional to y with a constant of proportionality equal to 1/k.
Regarding graphing, a direct variation between two quantities yields a straight line. Therefore, direct variation corresponds to a linear equation with two variables given by y = kx. The ratio of change (Δy/Δx) is also equal to k, representing the slope of the line. The graph of a direct variation is illustrated as follows:
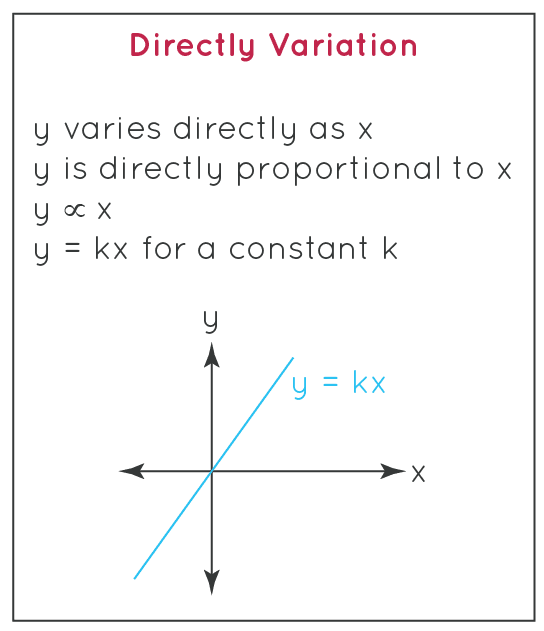
Direct relationships graph
3. Examples:
Here are two simple examples to aid in understanding the concept of direct relationships:
Example 1:
Consider the formula for the circumference of a circle, given by C = 2πr or C = πd. Here, r represents the radius, and d represents the diameter. This equation exemplifies a direct variation, as the circumference and diameter of a circle are directly related, with π serving as the constant of proportionality.
Example 2:
Let’s imagine that the number of iron boxes produced is directly proportional to the number of iron blocks used. Suppose it is known that 160 iron blocks are required to make 40 boxes. The task is determining the number of iron blocks needed for a single box.
In this problem, we can assign y as the number of iron blocks needed (y = 160) and x as the number of boxes (x = 40). The unknown quantity, the number of iron blocks required for a single box, can be represented as k. We can utilize the direct variation formula y = kx.
160 = k × 40
k = 160/40 = 4
Hence, it is determined that four iron blocks are needed for each box.
II. Linear Relationship
1. Definition:
The concept of a relationship between two variables, typically denoted as x and y, is best described as an essential aspect of statistical analysis. It is considered one of the simplest concepts to grasp. In a linear relationship, the plotted values of x and y always form a straight line on a graph. By examining the linear relationship between two factors, we can see the impact of their variations on each other and understand the nature of their correlation.
To illustrate this idea, let’s consider a real-world scenario of a grocery store. In this example, the budget of the store serves as the independent variable. At the same time, the number of items to be stocked represents the dependent variable. Assume the budget is fixed at $2,000, and the store has various options for stocking items. These options include 12 snack brands priced between $1 and $2 per pack, 12 cold drink brands priced between $2 and $4 per bottle, five cereal brands priced between $5 and $7 per pack, and 40 personal care brands priced between $3 and $30 per product. Due to budget constraints and the varying prices of items, purchasing more of one brand will necessitate purchasing fewer units of another.
2. Equation:
The linear correlation between these variables can be expressed using the formula y = mx + b.
Linear Relationship
In this equation, m represents the slope, b denotes the y-intercept, and x and y are the two variables. The y-intercept occurs when the resulting line on the graph intersects the y-axis at a specific value. At the y-intercept, the variable x must be equal to 0.
In this equation, m represents the slope, b denotes the y-intercept, and x and y are the two variables. The y-intercept occurs when the resulting line on the graph intersects the y-axis at a specific value. At the y-intercept, the variable x must be equal to 0.
The slope between the two points can be determined using this formula: m = (x2 – x1) / (y2 – y1).
3. Example:
Let’s illustrate the process using assumed values for the x and y variables:
x = 2, 4, 6, 8
y = 7, 13, 19, 25
To calculate m, we find the difference pattern between the x and y values and put them as a fraction: m = (y2 – y1)/(x2 – x1).
Plugging in the values from the x and y values above, we can calculate m as follows: m = (13-7)/(4-2) = 6/2 = 3.
Next, we find the hypothetical number (b) that needs to be added or subtracted in the formula to obtain the value of y. Thus: y = mx + b = 3*2 + 1 = 7. Using this value of b, we can determine the rest of the points.
Conclusion
A direct relationship is a proportional connection between two quantities, where an increase or decrease in one quantity corresponds to a corresponding increase or decrease. It can be determined by a linear equation in two variables, typically represented as y = kx, where k represents the constant of proportionality.
In a linear relationship, two variables are directly related, meaning that if one variable changes, the other must change in the same proportion. It can be mathematically expressed using the formula y = mx + b.